David de Gea and Hugo Lloris compared ahead of Manchester United v Tottenham
Manchester United host Tottenham live on Sky Sports this Saturday - but which club has the most formidable stopper?
United 'keeper David de Gea has conceded only four league
goals this season and kept seven clean sheets, while Tottenham's Hugo
Lloris isn't far behind with six shipped and five shutouts.
David De Gea has only conceded four goals and kept seven clean sheets from nine league games this season
Fewest goals conceded (500+ mins), PL 2017/18
Fewest goals conceded (500+ mins), PL 2017/18
|
Real
Madrid boss Zinedine Zidane praised compatriot Lloris before his side
hosted Spurs in the Champions League last week, saying: "He [Lloris]
will do everything for Spurs so they win. He's improved a lot there [at
Tottenham] and will be important for them."
And so it proved. The France international lived up to the pre-match
praise, blocking a Karim Benzema header from point-blank range. Days
earlier, De Gea, who almost signed for Real two years ago, had pulled
off a similar world-class save from Liverpool's Joel Matip during a 0-0
stalemate at Anfield.

Hugo Lloris has only conceded six goals and kept five clean sheets in the Premier League this season
But which 'keeper is more effective?
The
global football agency World in Motion's head of research and analytics
Sam Jackson has produced a detailed study of each stopper's
performances this season for his work with the agency's goalkeeping
division GK1 Management.
Using that data, in addition to Opta stats and expected goal (xG)
metrics, we take an in-depth look at how the two stoppers compare...
STYLE STATS

Besides
conceding fewer goals and keeping more clean sheets in the Premier
League this season, De Gea is almost twice as likely to launch balls
into the final third (38 to 20 this season).
But Lloris is far
more likely to make clearances (15 to four), act as a keeper sweeper (10
to four) and initiate breaks with throws (52 to 26).
Interestingly,
De Gea tends to pass to the right flank, having attempted 111 in that
direction, compared with only 66 to the left and 92 to the centre, while
Lloris' passes are distributed evenly.

SHOT-STOPPING & DIFFICULTY
Jackson
collects his own data to assess shot-stopping, and bases performance on
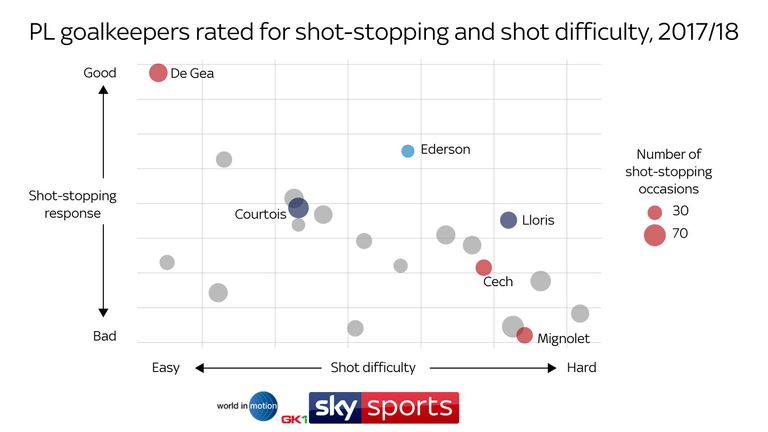
a combination of 'shot-stopping response' and 'shot difficulty.'
'Shot-stopping
response' is gauged by how well a 'keeper deals with a shot faced - was
it held at the first attempt, held at the second attempt, parried to
safety, parried back into the danger zone, or was a goal conceded?
Across
all competitions, the graph below reveals De Gea has offered the best
responses this season - but he has faced easier shots than any other
Premier League 'keeper.
The 'difficulty' part of the model factors
the location from where a shot was taken, shot destination, shot power
and whether the keeper's view was impaired.
Lloris has faced shots
that are more difficult to save, but records a mid-range rating for his
shot-stopping from those tougher shots.

DISTRIBUTION
For
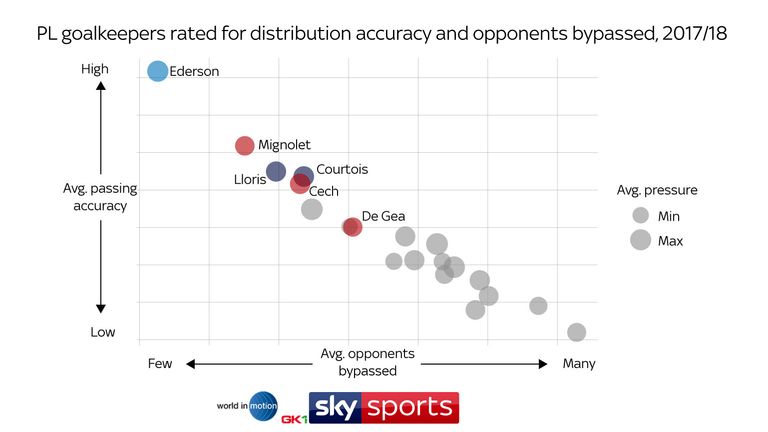
distribution, Jackson also collects his own data, and looks at whether
the 'keeper was under pressure to pass, the number of opponents
bypassed, and uses a measure of accuracy that makes it irrelevant
whether the 'keeper has a target man to aim for or not.
Lloris has been more accurate than De Gea with his distribution but only bypasses around two players per pass on average.

In
contrast, De Gea's distribution has been the least accurate of all
'keepers from the 'big six' clubs, but he attempts more long passes than
the other five - bypassing three players per distribution on average.

Jackson has calculated overall ratings for shot-stopping
and distribution - with these metrics combined, Manchester City's
Ederson emerges as the top performer
DEVELOPMENT & WEAKNESSES

Manchester United signed David De Gea in June, 2011
The
graph below shows how both keepers have recorded fairly consistent
ratios for clean sheets and saves over the past three seasons, although
De Gea has kept an above-average personal ratio for shutouts during this
campaign.


Tottenham signed Hugo Lloris in August, 2012
In
terms of weaknesses, Lloris has been more error-prone than the
Spaniard, recording far higher averages for errors leading to goals and
errors leading to shots, having made one mistake leading to a goal
against Chelsea this season, making two last season and three during
2015/16.

EXPECTED GOALS (xG)
Expected goals (xG) key points
- A shot from 8 yards has a higher xG value than a shot from 18 yards
- A shot taken by the foot has a higher xG value than a header
- A shot directly in front of goal has a higher xG value than a shot from a tight angle
According
to Opta's expected goals (xG) model, De Gea has prevented four goals
(numbers rounded) during this campaign that would be typically conceded,
while Lloris has shipped one more than he should have.

Which stopper will have the final say when the two teams meet on Saturday?


Post a Comment